How We Improved LoopBack REST Performance by 45%

Originally published on strongloop.com
Recently, I measured the performance of LoopBack 4 and found an opportunity for an easy but significant improvement in the way how we are building per-request context instances.
I have been always interested in performance, from high-level design patterns like caching & memoization, to micro-optimizations at language level (anybody remembers CrankShaftScript from Node.js 0.10 days?), all the way down to Mechanical Sympathy.
Since we started rewritting LoopBack from scratch in 2016/17, our primary focus was on features; performance aspects were a bit off the radar. (Not entirely, we were careful to design our HTTP routing layer to avoid the low performance of regexp-matching approach used by Express.) Now that LoopBack 4 is pretty mature, I though it's a good time to take a quick look on how fast is our framework.
To quickly get a high-level overview, I installed Clinic.js and benchmarked our TodoList example application. I used the following TodoList query (filter) for all benchmarks:
{
  "include": [
    {
      "relation": "todos"
    }
  ]
}
The filter value needs to be URL-encoded, producing the following URL to pass to Clinic.js - let's save it to a shell variable for later use.
$ URL="/todo-lists?filter=%7B%0A%20%20%22include%22%3A%20%5B%0A%20%20%20%20%7B%0A%20%20%20%20%20%20%22relation%22%3A%20%22todos%22%0A%20%20%20%20%7D%0A%20%20%5D%0A%7D"
Clinic.js Doctor
The Doctor component performs an overall diagnosis looking for common anti-patterns. After installing Clinic.js globally, I ran the following command in examples/todo-list directory of loopback-next monorepo:
$ clinic doctor --debug --autocannon $URL -- node .
Server is running at http://127.0.0.1:3000
Running 10s test @ http://localhost:3000/todo-lists?filter=(...)
10 connections
(...)
18k requests in 11.05s, 11.1 MB read
Analysing data
Generated HTML file is file:///(...)/todo-list/.clinic/41598.clinic-doctor.html
You can use this command to upload it:
clinic upload .clinic/41598.clinic-doctor
The report says there were no issue detected, hooray!

A closer inspection shows that our process is consuming quite a lot of memory. We don't have any memory leaks, which is most important. However, excessive allocations put more pressure on garbage collector which does impact application's performance. Let's set the memory usage aside for now and check how much time is the application spending on waiting for asynchronous operations.
Clinic.js Bubbleprof
Quoting from ThoughtWorks Technology Radar:
Clinic.js Bubbleprof represents visually the async operations in Node.js processes, drawing a map of delays in the application's flow. We like this tool because it helps developers to easily identify and prioritize what to improve in the code.
Let's see how the bubbles look like for a LoopBack application!
$ clinic bubbleprof --debug --autocannon $URL -- node .
Warning: The code is transpiled, bubbleprof does not support source maps yet.
Server is running at http://127.0.0.1:3000
Running 10s test @ http://localhost:3000/todo-lists?filter=(...)
10 connections
(...)
2k requests in 10.06s, 1.28 MB read
Analysing data
Generated HTML file is file:///(...)/todo-list/.clinic/42229.clinic-bubbleprof.html
You can use this command to upload it:
clinic upload .clinic/42229.clinic-bubbleprof
There isn't much to see in the report, the application spent less than 20ms waiting for async operations. I guess that was kind of expected considering that our example application is using in-memory storage and not communicating with any external service.

Clinic.js Flame
The last item in Clinic.js toolbox is Flame. Quoting from Clinic's website:
(...) flamegraphs are a visualization of profiled software, allowing the most frequent code-paths to be identified quickly and accurately. Clinic.js Flame is specifically for Node.js and is built into Clinic.js. It collects metrics using by CPU sampling, then tracks top-of-the-stack frequency and creates flamegraphs.
Can we find anything interesting in the flames? Let's see.
$ clinic flame --debug --autocannon $URL -- node .
Server is running at http://127.0.0.1:3000
Running 10s test @ http://localhost:3000/todo-lists?filter=(...)
10 connections
15k requests in 10.03s, 9.44 MB read
Analysing data
Generated HTML file is file:///(...)/todo-list/.clinic/42454.clinic-flame.html
You can use this command to upload it:
clinic upload .clinic/42454.clinic-flame
There is a lot of information packaged into a flame graph. Initially, Clinic.js is selecting the hottest frame - the stack that was observed most often while running the application. In our case, the hottest frame is pointing to Node.js internals dealing with writing data to streams.

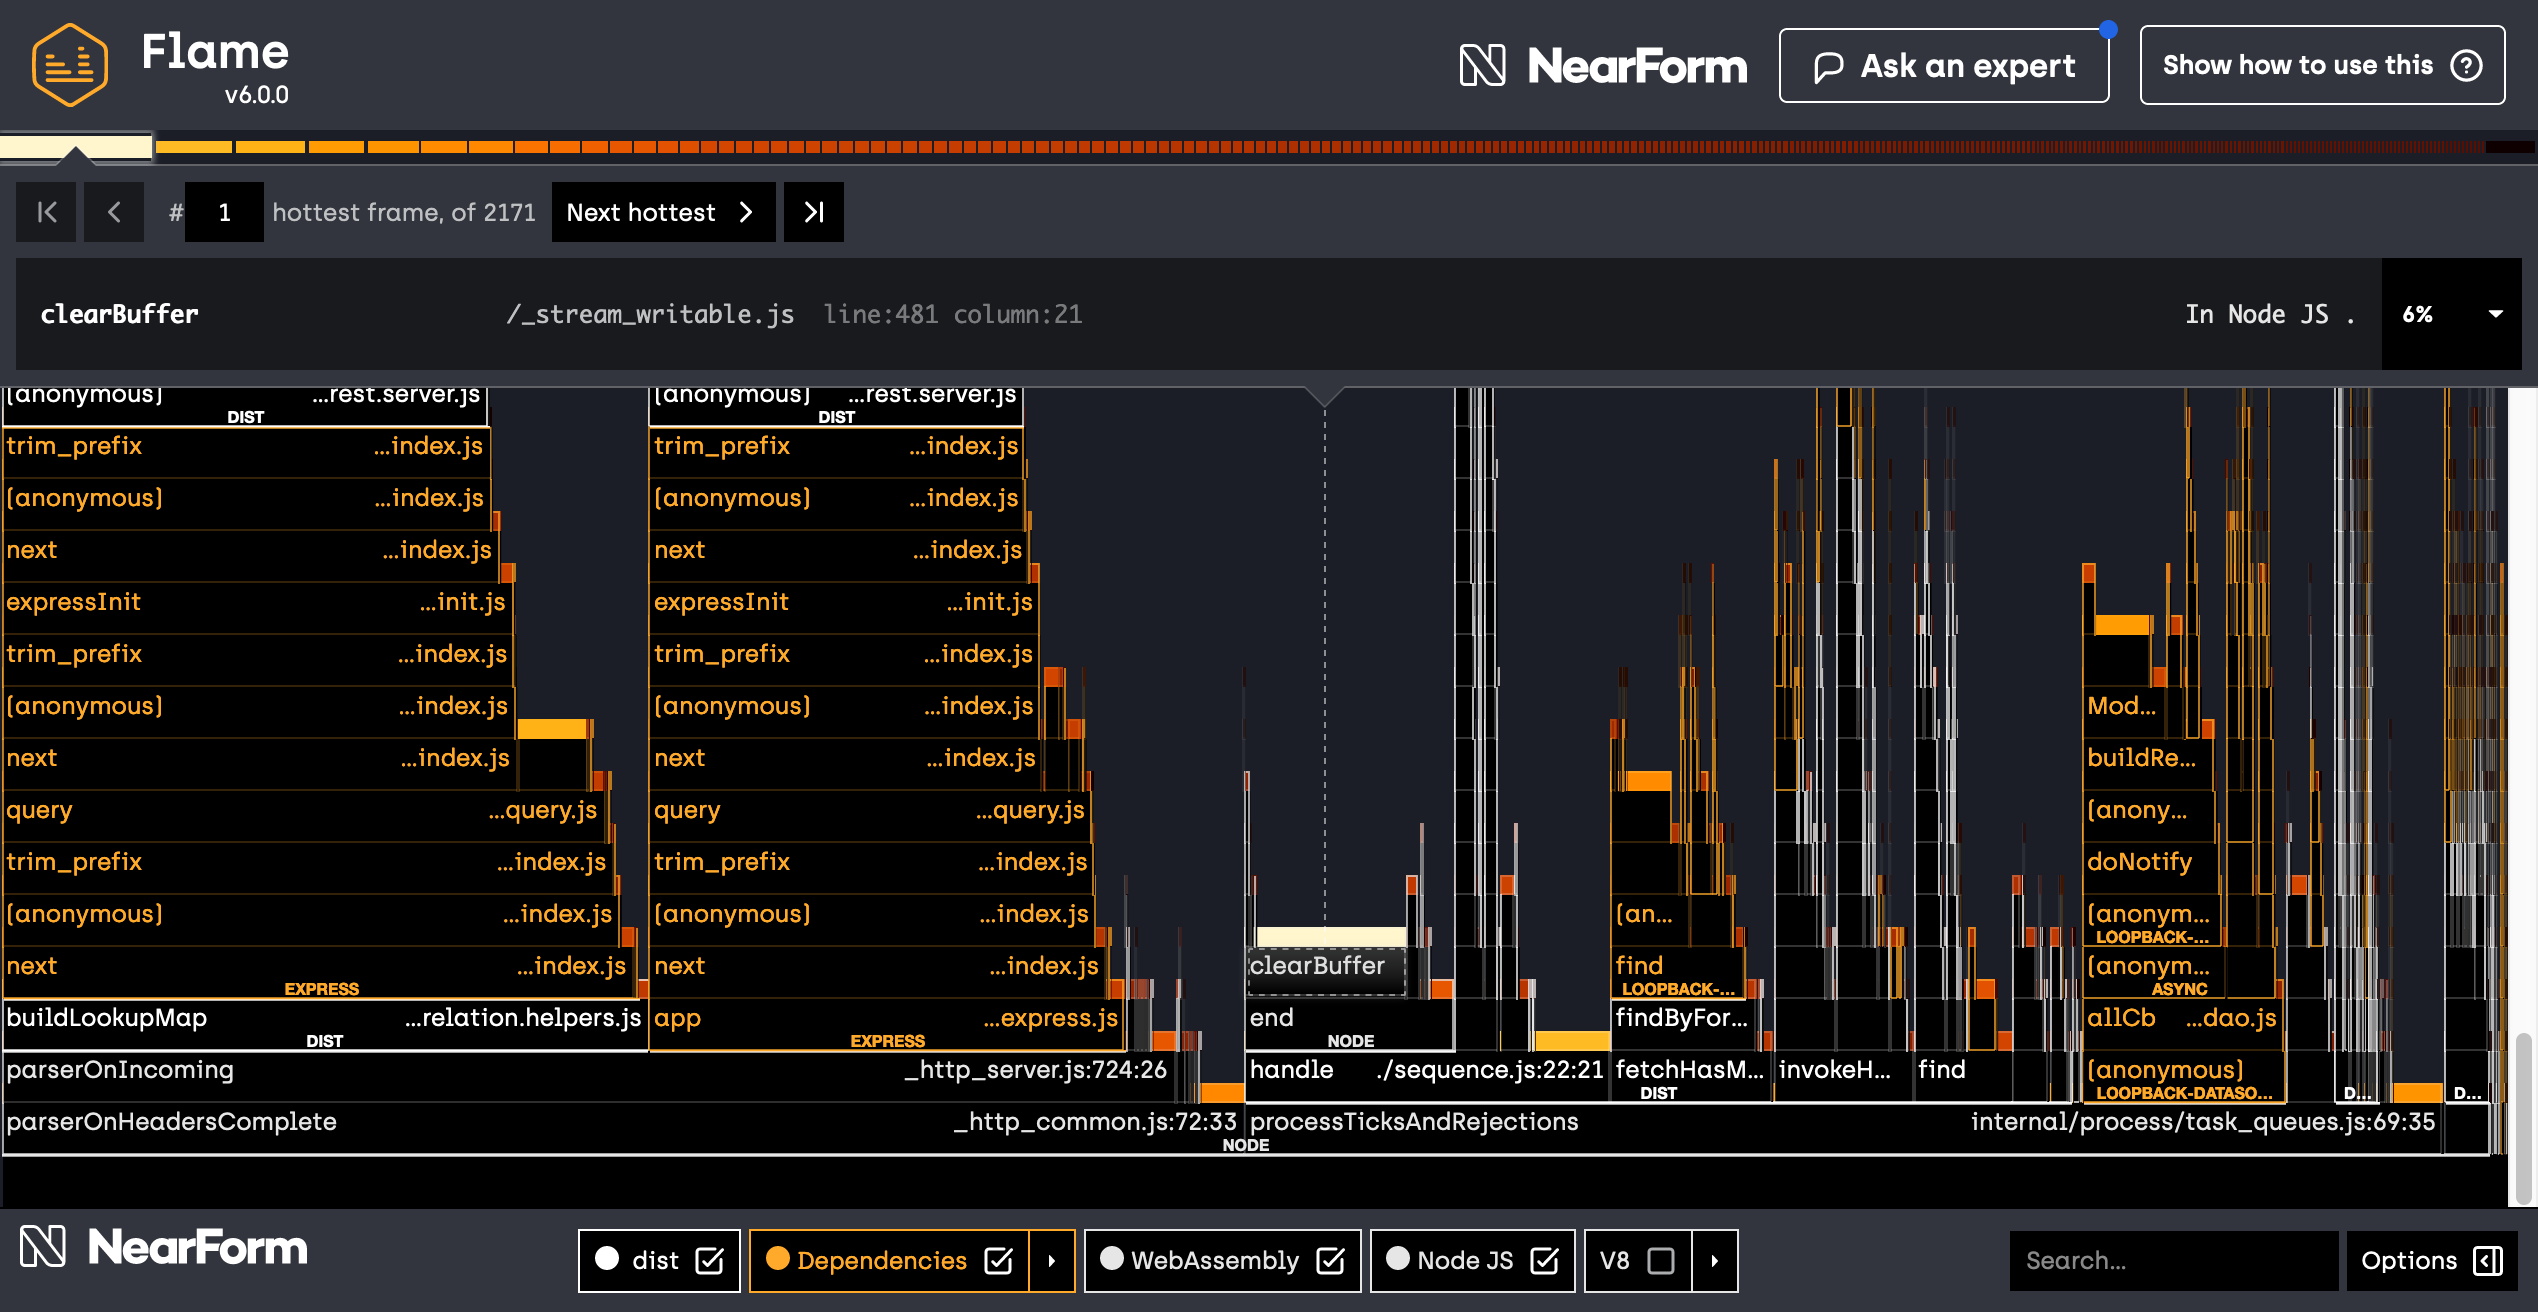
There isn't much we can do about Node.js streams. Our application is writing HTTP responses so it has to spend some time writing the data. The third hottest frame is parseQueryStringValues from the module qs, this is again not something we can easily improve. Let's remove all components except dist in the check-box list at the bottom of the screen to focus on LoopBack code only.
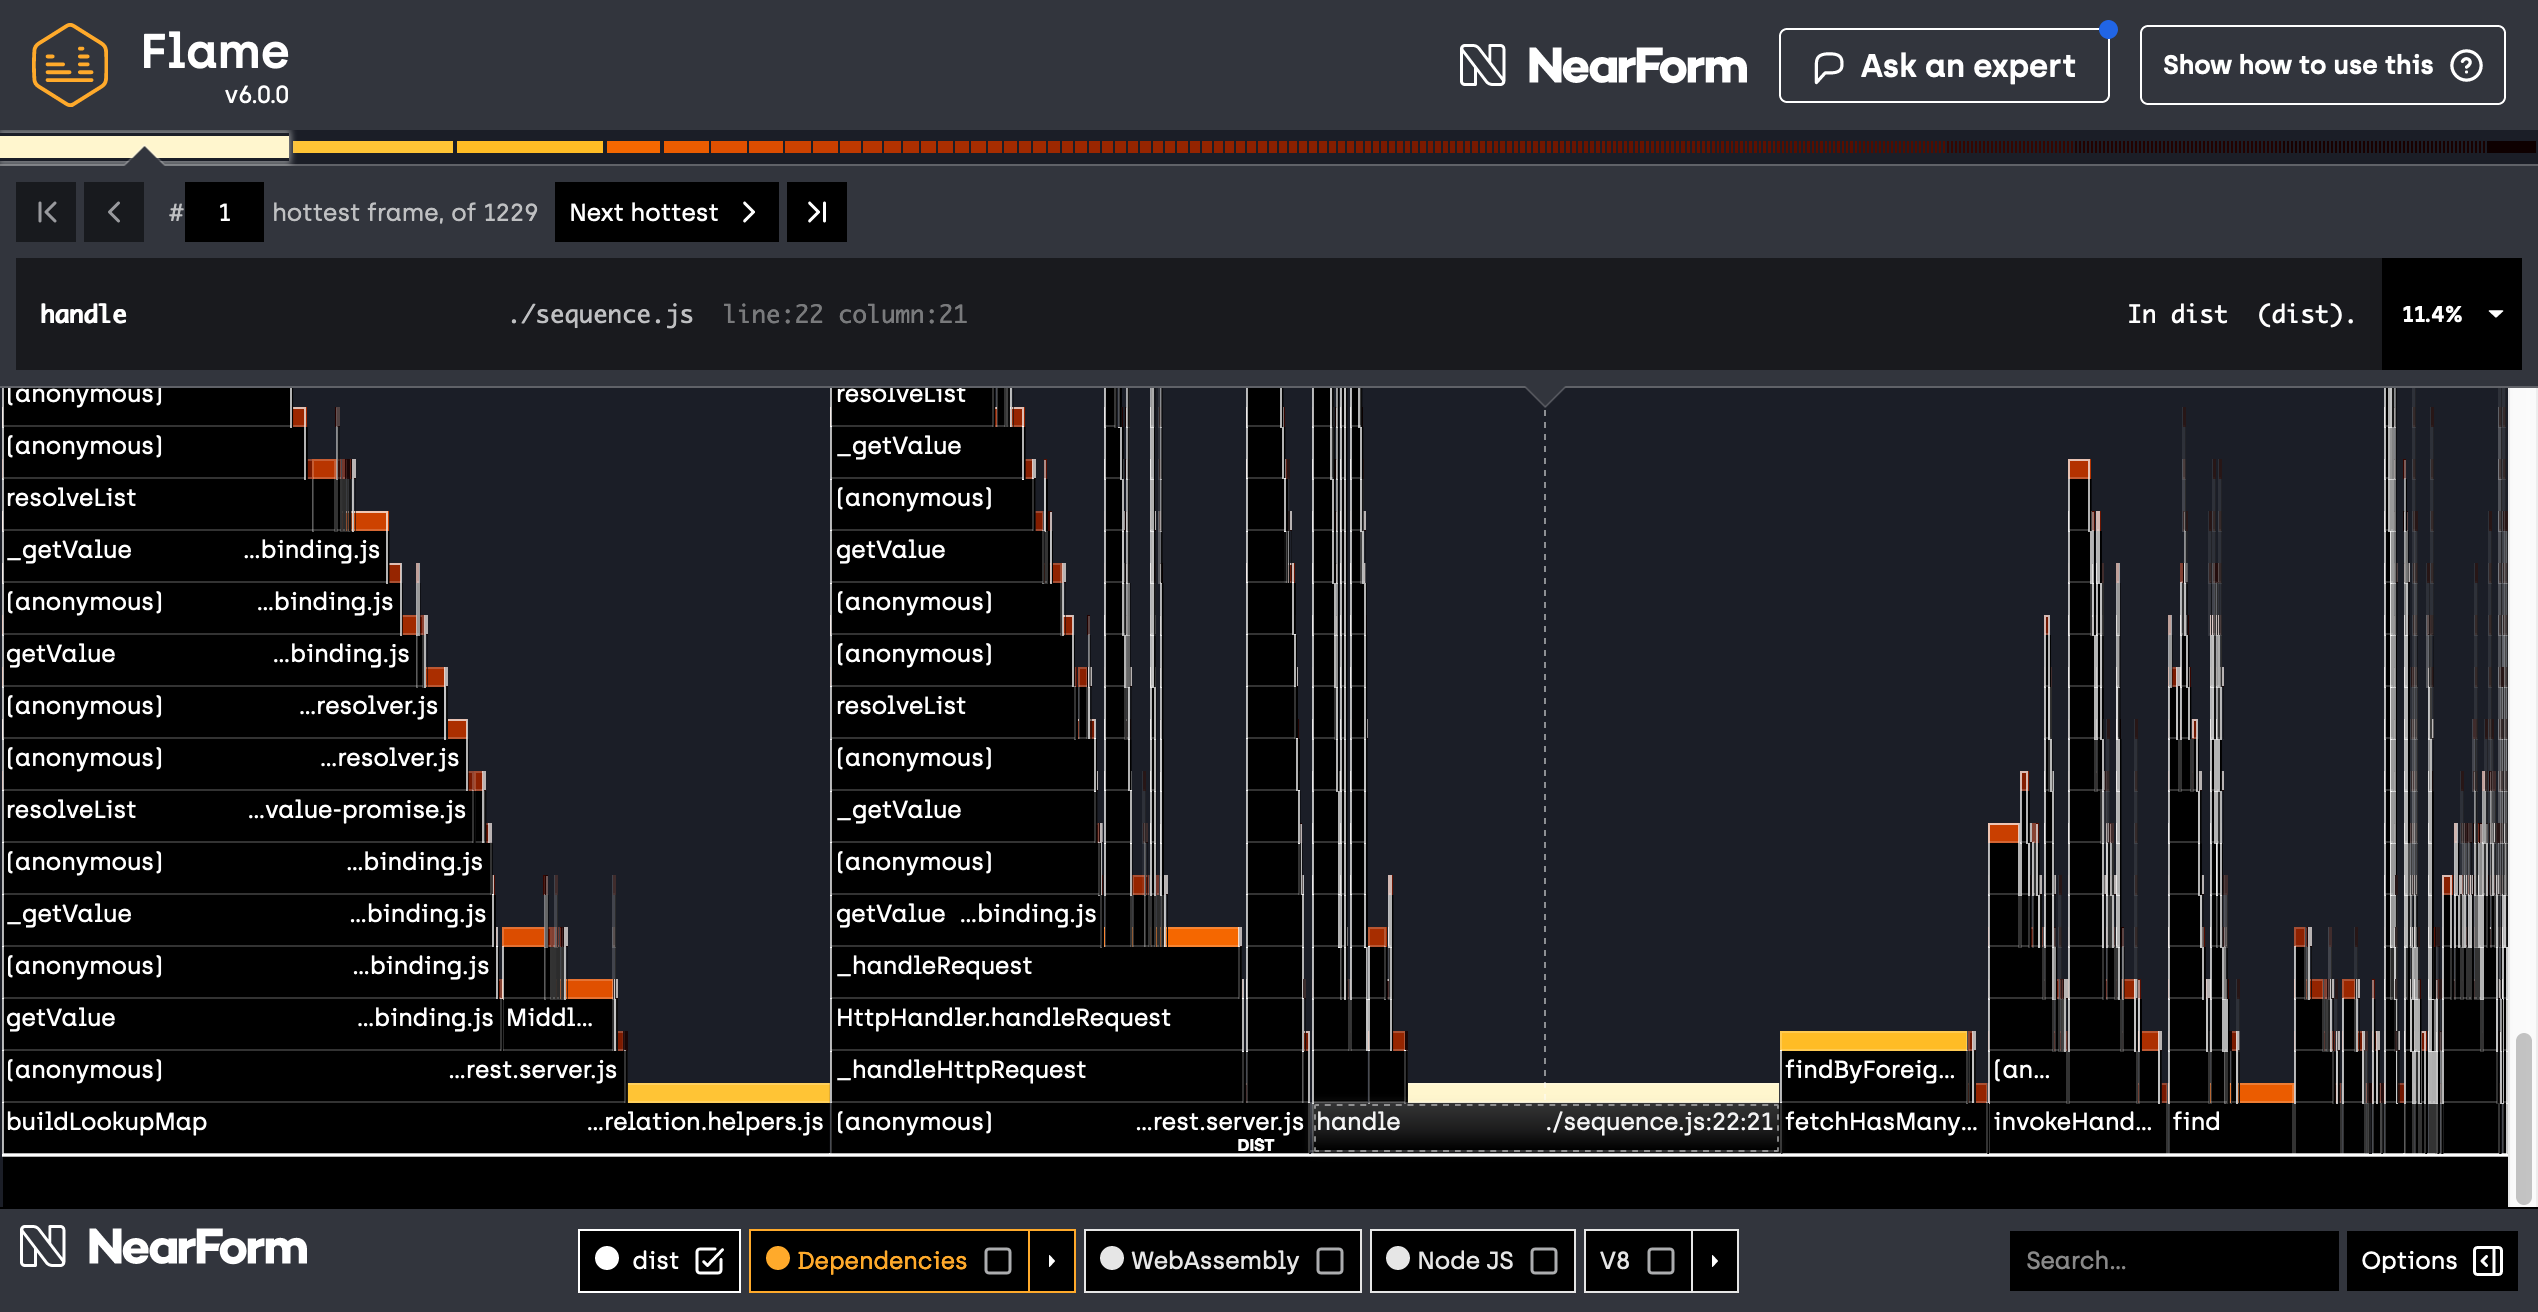
Now the list of hot frames looks much more actionable! Here are the top entries:
handleinsequence.jswas 11.4% of time on top of stackbuildLookupMapinrelation.helpers.jswas 6.3% of time on top of stackfindByForeignKeysinrelation.helpers.jswas 5.7% of time on top of stack
And so the list goes on. The entry number 7 caught my attention: the application is spending 1.3% of the time in generateName from context.js. That's suspicious, why is generating context names so expensive?
It turns out we are generating unique context names to make it easier to debug binding-related issues. Our initial implementation was based on UUID version 4 (random) algorithm. Universally unique ids are great when you are aggregating debug logs from a mesh of microservices. However, most of the time, context names are just a hidden property of context instances that's not surfaced anywhere. Applications shouldn't be paying performance tax for something they don't use. Let's see if we can find a better solution.
UUID Alternatives
What other options are there to generate unique ids?
- We can use UUID version 1 that's based on date-time and MAC address.
- If we didn't need universally unique values, then a simple counter (perhaps prefixed with the current process id) could be a viable alternative.
- Surely somebody else must have encountered this problem before us. Aren't there any fast id generators on npmjs.com? Of course there are! The search for "fast unique id" returned hyperid as the best match.
Let's compare the performance of these alternatives. I wrote a simple benchmark which you can find in this Gist and measured the following data:
| method | ids/second |
|---|---|
| numeric counter | 11095k |
| hyperid | 10234k |
| UUID v1 | 1649k |
| UUID v4 | 325k |
Initially, I wanted to use a numeric counter because it has the best performance. However, that would mean losing uniqueness of context names. At the end, I decided to go with hyperid. It combines UUID v4 with a counter to achieve almost the same performance as the counter-only algorithm while preserving universal uniqueness of the generated ids.
To better measure the impact on performance, I created a small REST application that does not parse the query string and returns the response data directly, without going through @loopback/repository. Replacing uuid/v4 with hyperid improved the performance of my test application from ~2.4k requests/second to ~3.5k requests/second on average. The average request latency has improved from 3.8ms to 2.6ms.
The pull request loopback-next#5628 improving generateName performance has been already landed and will become publicly available in the next framework release.
Summary
As the popular saying goes, performance is not a problem until it becomes a problem. Even if your project is not performance sensitive, it's still good to pay attention to how much resources it consumes at runtime.
-
Watch for warning signs. Maybe an existing test has suddenly started to fail on a timeout? When that happens, try to take the hard path: investigate the problem, dig deep to find the root cause and fix it.
-
Measure, measure, measure. Always create a reproducible benchmark to measure the effect of the changes you are going to make. Performance tuning is full of surprises and not all changes are for better.
-
Know the tooling. Node.js is compatible with many tools provided by Chrome's Developer Tools, it provides also tracing functionality for a more fine-grained analysis. You can learn more in Node.js documentation, starting from Debugging - Getting Started, Easy profiling for Node.js Applications and Flame Graphs.
-
Optimize hot paths. A semi-expensive function can become a performance problem when it's called for every incoming request.
Call to Action
LoopBack's success depends on you. We appreciate your continuous support and engagement to make LoopBack even better and meaningful for your API creation experience. Here's how you can join us and help the project:
- Join the community Slack chat
- Report issues.
- Contribute code and documentation.
- Open a pull request on one of our "good first issues".