In general, when you are developing an application, use the npm command to run
it. This enables you to see stack traces and console output immediately.
For example:
$ cd myapp
$ npm start
LoopBack 4 also provides multiple ways to help you verify or diagnose the app.
Setting Debug Strings
If you get an error but it doesn’t provide enough information, you can turn on
debug mode by starting your application using DEBUG=<DEBUG_STRING> npm start.
See Setting debug strings for details.
Running Tests with Mocha
You can debug tests by running mocha commands as documented on page Debugging with Mocha tests.
Resolving Commonly Found Errors
Binding key not bound error
With high extensibility, a LoopBack application usually contains tens of bindings. It usually take a few iterations to setup all of them. A commonly seen binding error is “a binding key not bound”, for example:
500 Error: The key 'services.hasher' is not bound to any value in context application
Here are some potential reasons:
- The key is not bound to any value.
To fix it, you should set the value for the binding key in the application.
For example, go to your application, typically it is in src/application.ts
file:
import {Hasher} from '/services/hasher';

export class TodoListApplication extends BootMixin(
  ServiceMixin(RepositoryMixin(RestApplication)),
) {
  constructor(options: ApplicationConfig = {}) {
    super(options);
    // Add your binding here
    this.bind(services.hasher).toClass(Hasher);
  }
}
- Incorrect injection key.
When injecting a binding, make sure its name is correct. Especially for the ones
following LoopBack artifact naming conventions. For example, the automatically
bound services have their class name as <ServiceName>Provider and the binding
key as services.<ServiceName>. So use @inject('services.UserService')
instead of @inject('services.UserServiceProvider').
See more details in Binding documentation page.
- Missing components.
If the binding is exported by a component, ensure the component is installed and binding is imported correctly.
- Compiled files not updated.
See section compiled files not updated.
Compiled Files not Updated
The TypeScript application is compiled to JavaScript files and runs. Forgetting
to rebuild could run into errors. Make sure you rebuild the project before
re-running the application. By default, if you start the application using
npm start, it rebuilds the project for you.
In some cases, the compiled JS files might not get updated properly even you build the project. For example, you deleted a Controller file but still get errors about the removed Controller during application startup, it implies the compiled JS files probably didn’t get updated.
To fix it, run npm run clean to delete all the compiled files. By doing so, it
forces the build to generate the compiled JS files next time when you start the
application using npm start or call npm run build.
Debugging with VS Code
Each LoopBack application has a VS Code configuration file .vscode/launch.json
that contains several tasks to help you debug with breakpoints:
Launch Program: Running the application.Run Mocha tests: Running the tests undersrc/__tests__.Attach to Process: Attaching application to an already running program in debug mode.
To bring up the run view, select the “Run” icon in the activity bar on the side of VS Code. You can choose the right task besides the green triangle “Run” button.
To properly debug make sure that the LoopBack application is running in
Node Debug mode.
This is usually done via the node --inspect flag.
Creating Breakpoints
Make sure to start the LoopBack application in Node Debug mode.
The easiest way to start debugging and creating breakpoints is by using the
Attach to Process in the “Run” menu in VSCode and select the LoopBack
application process that you started.
Here’s how you can do set a breakpoint:
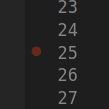
- Locate the specific line number you want to pause on when the LoopBack application reaches that spot.
- Hover over to the left of the line number and you will see a dull red circle

- Left-clicking on the circle turns it into a bright red circle and remains there even after moving the cursor away. This means that the breakpoint has been set.

To remove the breakpoint, left-click on the red circle again or right-click and
select Remove Breakpoint.
To suspend the breakpoint, you can right-click on the red circle and select
Disable Breakpoint. The circle will now be grey. This will keep the
breakpoint, but prevent it from pausing the LoopBack process on that line. You
can re-enable the breakpoint by right-clicking and selecting
Enable Breakpoint.
Submitting Sample Application for Problem Determination
If you couldn’t figure out what is going wrong or would like to report an issue, you can submit a simplified application that contains the problematic code following the guide in reporting LoopBack 4 bugs. So that we can help you diagnose the problem.